|
Site Analysis Report
|
u_ex170101 (2).log Thursday Transmission

|
Thursday Transmission |
| |
Time |
Hits |
% |
Bytes |
% |
Sessions |
Visitors |
Pages |
Errors |
|
1 |
00:00 - 00:59 |
|
|
5 |
4 |
141 |
37 |
|
2 |
01:00 - 01:59 |
|
|
7 |
4 |
43 |
13 |
|
3 |
02:00 - 02:59 |
|
|
14 |
13 |
40 |
27 |
|
4 |
03:00 - 03:59 |
|
|
9 |
8 |
28 |
10 |
|
5 |
04:00 - 04:59 |
|
|
6 |
6 |
49 |
38 |
|
6 |
05:00 - 05:59 |
|
|
5 |
4 |
17 |
9 |
|
7 |
06:00 - 06:59 |
|
|
4 |
4 |
2 |
2 |
|
8 |
07:00 - 07:59 |
|
|
5 |
5 |
6 |
2 |
|
9 |
08:00 - 08:59 |
|
|
9 |
9 |
6 |
2 |
|
10 |
09:00 - 09:59 |
|
|
28 |
28 |
42 |
6 |
|
11 |
10:00 - 10:59 |
|
|
16 |
15 |
36 |
4 |
|
12 |
11:00 - 11:59 |
|
|
8 |
7 |
102 |
30 |
|
13 |
12:00 - 12:59 |
|
|
14 |
13 |
19 |
13 |
|
14 |
13:00 - 13:59 |
|
|
10 |
9 |
131 |
52 |
|
15 |
14:00 - 14:59 |
|
|
5 |
5 |
4 |
0 |
|
16 |
15:00 - 15:59 |
|
|
7 |
7 |
4 |
0 |
|
17 |
16:00 - 16:59 |
|
|
35 |
35 |
5 |
2 |
|
18 |
17:00 - 17:59 |
|
|
0 |
0 |
0 |
0 |
|
19 |
18:00 - 18:59 |
|
|
5 |
5 |
19 |
7 |
|
20 |
19:00 - 19:59 |
|
|
11 |
11 |
5 |
0 |
|
21 |
20:00 - 20:59 |
|
|
3 |
3 |
3 |
1 |
|
22 |
21:00 - 21:59 |
|
|
2 |
2 |
3 |
0 |
|
23 |
22:00 - 22:59 |
|
|
2 |
2 |
2 |
0 |
|
24 |
23:00 - 23:59 |
|
|
3 |
3 |
5 |
1 |
| |
Average |
|
|
8 |
8 |
29 |
10 |
|
24 |
Totals |
|
|
1,217 |
565 |
712 |
256 |
|
|
|
 |
 |
 |

|
|
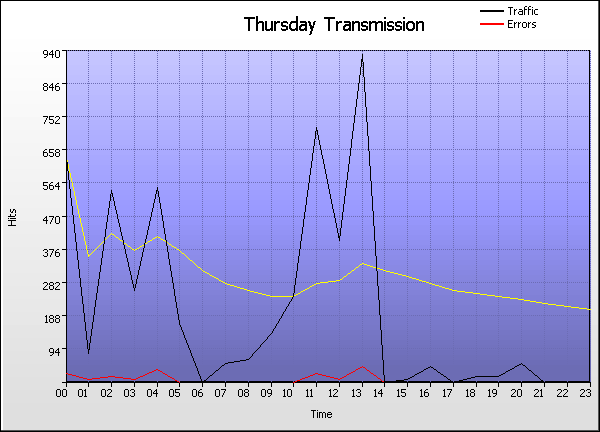
Help Card: Thursday Transmission |
 |
This report details the hour-by-hour breakdown of traffic generated on all Thursdays. Use this information to assess the damage of unforeseen downtime, or to find key traffic spikes that could be used to influence special features or promotions.
This report may be affected by world time zones. Many webservers generate timestamps in Greenwich Mean Time (GMT+0), which may not be your local time zone. The time data in your logs can be adjusted to represent your local time zone, in Settings > Analysis > Options > Date range > Time adjust.
|
|
 |
Vertical axis: Hits (default sorting).
Number of hits to the site. Changing the sorting options in Settings > Statistics will alter the vertical axis to the new sort method (Visitors, Bytes, etc). This report may be sorted by hits, bytes, sessions, visitors, pages or errors.
Horizontal axis: Time
The hour of the day.
Red line (if present):
HTTP errors (Page not found, server error, etc)
|
|
 |
Time:
The hourly period of the corresponding day.
Hits (%):
Number of hits to the site during the corresponding hourly period. (Percentage as a proportion of hits to the site during the day's 24 hours.)
Bytes (%):
Number of bytes transferred as a result of hits to the site during the corresponding hourly period. For readability, these values may be suffixed with kilobytes (KB), megabytes (MB) or gigabytes (GB), where applicable. (Percentage as a proportion of bytes transferred during the day's 24 hours.)
Sessions:
Total number of sessions undertaken during the corresponding hourly period. This number includes sessions undertaken by 'repeat' visitors.
Visitors:
Total number of unique visitors who undertook one or more sessions during the corresponding hourly period. Note that this figure represents a unique hourly visitor count, not a unique daily visitor count (as a unique visitor for one hour may return in another hour). As such, the "Totals" value will be cumulative for the 24 hours and the overall totals for individual days may appear higher than expected.
Pages
Number of pages viewed during the corresponding hourly period.
Errors
Number of server errors generated as a result of hits to the site during the corresponding hourly period.
|
|
|
|

|
|