Site Analysis Report u_ex170101 (2).log Pages

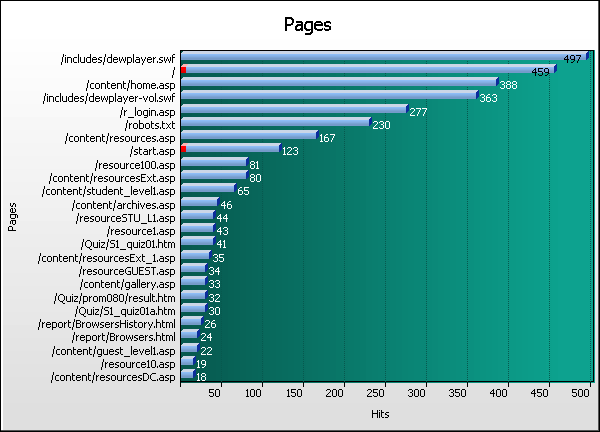
Pages Graph
Go the Help Card.


Pages
  Pages Hits % Bytes % Sessions Mean Time Visitors Errors
1 /includes/dewplayer.swf
497    13.4%
0    0%
51 07:40 8 0
2 /
459    12.4%
0    0%
359 00:24 191 5
3 /content/home.asp
388    10.5%
0    0%
171 02:11 60 0
4 /includes/dewplayer-vol.swf
363    9.78%
0    0%
70 03:16 25 0
5 /r_login.asp
277    7.47%
0    0%
83 02:22 19 0
6 /robots.txt
230    6.20%
0    0%
192 00:16 137 0
7 /content/resources.asp
167    4.50%
0    0%
86 01:11 16 0
8 /start.asp
123    3.32%
0    0%
52 01:19 14 5
9 /resource100.asp
81    2.18%
0    0%
40 01:10 10 0
10 /content/resourcesExt.asp
80    2.16%
0    0%
38 03:59 9 0
11 /content/student_level1.asp
65    1.75%
0    0%
26 01:50 4 0
12 /content/archives.asp
46    1.24%
0    0%
22 03:36 4 0
13 /resourceSTU_L1.asp
44    1.19%
0    0%
18 01:57 4 0
14 /resource1.asp
43    1.16%
0    0%
30 00:53 12 0
15 /Quiz/S1_quiz01.htm
41    1.11%
0    0%
15 01:53 4 0
16 /content/resourcesExt_1.asp
35    <1%
0    0%
17 01:09 7 0
17 /resourceGUEST.asp
34    <1%
0    0%
9 04:36 3 0
18 /content/gallery.asp
33    <1%
0    0%
24 00:47 9 0
19 /Quiz/prom080/result.htm
32    <1%
0    0%
14 07:09 4 0
20 /Quiz/S1_quiz01a.htm
30    <1%
0    0%
13 02:28 4 0
21 /report/BrowsersHistory.html
26    <1%
0    0%
26 00:08 25 0
22 /report/Browsers.html
24    <1%
0    0%
24 00:11 23 0
23 /content/guest_level1.asp
22    <1%
0    0%
9 01:46 3 0
24 /resource10.asp
19    <1%
0    0%
11 00:51 5 0
25 /content/resourcesDC.asp
18    <1%
0    0%
10 01:08 5 0
26 /report/Browsers-OperatingSystems.html
17    <1%
0    0%
17 00:11 15 0
27 /content/student_guide.asp
16    <1%
0    0%
11 00:56 3 0
28 /report/TopLevelDirectoriesHistory.html
16    <1%
0    0%
16 00:01 14 0
29 /content/guest_level2.asp
14    <1%
0    0%
8 01:26 3 0
30 /report/index.html
14    <1%
0    0%
14 00:14 14 0
31 /content/drumcorp_level1.asp
13    <1%
0    0%
5 02:38 3 0
32 /resourceSTU_L3.asp
13    <1%
0    0%
8 01:10 4 0
33 /videotest.html
13    <1%
0    0%
6 02:58 2 0
34 /resourceDC_L1.asp
12    <1%
0    0%
5 05:05 3 0
35 /content/guest_level3.asp
12    <1%
0    0%
7 01:07 3 0
36 /content/gallery_2.asp
12    <1%
0    0%
10 01:36 5 0
37 /content/student_level2.asp
10    <1%
0    0%
3 02:36 3 0
38 /content/student_level3.asp
10    <1%
0    0%
4 01:40 3 0
39 /content/resourcesDC_3.asp
10    <1%
0    0%
4 05:53 2 0
40 /Quiz/D1_quiz01.htm
9    <1%
0    0%
3 01:27 2 0
  Subtotals
3,368    90.8%
0    0%
1,531 39:59:45 684 10
131 Others
342    9.22%
0    0%
308 03:46:42 281 106
  Average
21    <1%
0    0%
10 01:25 5 0
171 Totals
3,710    100%
0    0%
1,839 43:46:27 965 116
Go the Help Card.

Help Card: Pages
Report Overview This report shows the most popular pages being viewed on your site, according to the page extensions defined in Settings > Analysis > Extensions > Pages. Use this information to see whether important content is being viewed by the majority of site visitors. If not, you may need to restructure your site to ensure that this critical information is easily located.

Graph Description Vertical axis: Pages.
Name of the page being analyzed.

Horizontal axis: Hits (default sorting).
Changing the sorting options in Settings > Statistics will alter the horizontal axis to the new sort method. This report can be sorted/graphed by hits, bytes, sessions, visitors or errors.

Red lines (if present):
HTTP errors (Page not found, server error, etc)

Table Description Pages:
Name of the page being analyzed. The directory path shown is from the document root ("/") of your webserver. Click the hyperlink to view the page (note: for these links to work, you must specify your default hostname in Settings > Analysis > Options > URL > Default host.

Hits (%):
Number of hits to the corresponding page. (Percentage as a proportion of all hits to files regarded as pages.)

Bytes (%):
Raw bytes transferred as a result of hits to the corresponding page. (Percentage as a proportion of all bytes transferred through page hits.)

Sessions:
Number of sessions in which the corresponding page was viewed. This value includes multiple views of the corresponding page by the same site visitor.

Mean Time:
The average amount of time spent on the corresponding page by all site visitors.

Visitors:
Number of unique visitors who viewed the corresponding page.

Errors:
Number of server errors generated as a result of hits to the corresponding page. The total number of errors in this report will not necessarily reflect the total number of errors in the log files, as errors that are not for pages (eg gifs) will not be included in the report.
Go back to the top.

Copyright © Duplex IT Reporting , 2016