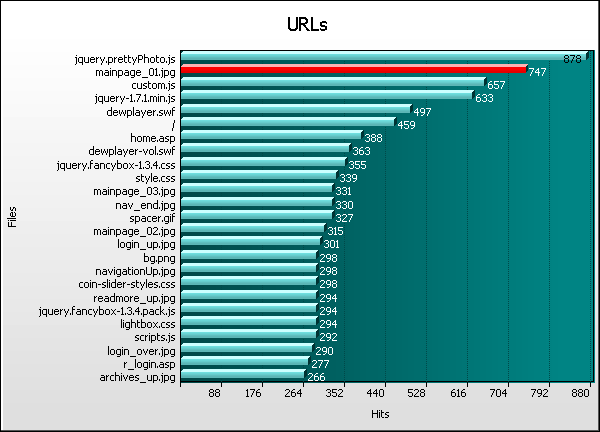
Site Analysis Report u_ex170101 (2).log URLs

Files Graph
Go the Help Card.


URLs
  Files Hits % Bytes % Errors
1 /scripts/jquery.prettyPhoto.js
878    3.35%
0    0%
0
2 /images/mainpage_01.jpg
747    2.85%
0    0%
747
3 /scripts/custom.js
657    2.50%
0    0%
0
4 /scripts/jquery-1.7.1.min.js
633    2.41%
0    0%
0
5 /includes/dewplayer.swf
497    1.89%
0    0%
0
6 /
459    1.75%
0    0%
5
7 /content/home.asp
388    1.48%
0    0%
0
8 /includes/dewplayer-vol.swf
363    1.38%
0    0%
0
9 /fancybox/jquery.fancybox-1.3.4.css
355    1.35%
0    0%
0
10 /css/style.css
339    1.29%
0    0%
0
11 /images/mainpage_03.jpg
331    1.26%
0    0%
0
12 /images/nav_end.jpg
330    1.26%
0    0%
0
13 /images/spacer.gif
327    1.25%
0    0%
0
14 /images/mainpage_02.jpg
315    1.20%
0    0%
0
15 /images/login_up.jpg
301    1.15%
0    0%
0
16 /images/bg.png
298    1.14%
0    0%
0
17 /images/navigationUp.jpg
298    1.14%
0    0%
0
18 /css/coin-slider-styles.css
298    1.14%
0    0%
0
19 /images/readmore_up.jpg
294    1.12%
0    0%
0
20 /fancybox/jquery.fancybox-1.3.4.pack.js
294    1.12%
0    0%
0
21 /css/lightbox.css
294    1.12%
0    0%
0
22 /scripts/scripts.js
292    1.11%
0    0%
0
23 /images/login_over.jpg
290    1.11%
0    0%
0
24 /r_login.asp
277    1.06%
0    0%
0
25 /images/archives_up.jpg
266    1.01%
0    0%
0
26 /images/archives_over.jpg
265    1.01%
0    0%
0
27 /images/morelinks_up.jpg
265    1.01%
0    0%
0
28 /images/morelinks_over.jpg
265    1.01%
0    0%
0
29 /images/readmore_over.jpg
265    1.01%
0    0%
0
30 /images/enter_up.jpg
264    1.01%
0    0%
0
31 /images/enter_over.jpg
264    1.01%
0    0%
0
32 /images/1984.png
261    <1%
0    0%
0
33 /scripts/innerfade.js
259    <1%
0    0%
0
34 /scripts/jquery.lightbox-0.5.min.js
259    <1%
0    0%
0
35 /photos/rds_manuscript.jpg
258    <1%
0    0%
0
36 /scripts/coin-slider.js
258    <1%
0    0%
0
37 /photos/rds022sm.jpg
258    <1%
0    0%
0
38 /photos/rds2010.jpg
257    <1%
0    0%
0
39 /images/rds-logo.png
252    <1%
0    0%
0
40 /photos/gallery/rds033.jpg
237    <1%
0    0%
0
  Subtotals
13,708    52.3%
0    0%
752
556 Others
12,526    47.7%
0    0%
417
  Average
44    <1%
0    0%
1
596 Totals
26,234    100.0%
0    0%
1,169
Go the Help Card.

Help Card: URLs
Report Overview This report identifies the most accessed URLs (Universal Resource Locators, such as http://www.quest.com/funnel_web/) on your web site. Use this information to see if your most important files are receiving the appropriate number of hits. The information may be skewed if your site uses frames, since base frame pages tend to receive more hits than pages deeper within the actual frames. This report is most powerful when used in conjunction with filters, to include or exclude particular files, such as base frame pages or graphic files. If you are interested in the most accessed pages, rather than full URLs, see the Pages report.

Graph Description Vertical axis: Files.
Name of the URL being analyzed.

Horizontal axis: Hits (default sorting).
Changing the sorting options in Settings > Statistics will alter the horizontal axis to the new sort method. This report can be sorted/graphed by hits, bytes and errors.

Red lines (if present):
HTTP errors (Page not found, server error, etc)

Table Description Files:
Name of the URL being analyzed. The directory path shown is from the document root ("/") of your webserver. Click the hyperlink to view the page (note: for these links to work, you must specify your default hostname in Settings > Analysis > Options > URL > Default host.

Hits (%):
Number of hits to the corresponding URL. (Percentage as a proportion of hits to all URLs.)

Bytes (%):
Bytes transferred as a result of hits to the corresponding URL. (Percentage as a proportion of bytes transferred for all hits.)

Errors:
Errors generated as a result of hits to the corresponding URL.
Go back to the top.

Copyright © Duplex IT Reporting , 2016