|
Site Analysis Report
|
u_ex170101 (2).log File Types

|
File Types |
| |
File Type |
Hits |
% |
Bytes |
% |
Errors |
|
1 |
.jpg |
|
|
759 |
|
2 |
.js |
|
|
46 |
|
3 |
.png |
|
|
137 |
|
4 |
.css |
|
|
16 |
|
5 |
.asp |
|
|
7 |
|
6 |
.gif |
|
|
52 |
|
7 |
.swf |
|
|
0 |
|
8 |
.html |
|
|
17 |
|
9 |
.mp4 |
|
|
6 |
|
10 |
.txt |
|
|
0 |
|
11 |
.ico |
|
|
0 |
|
12 |
.htm |
|
|
0 |
|
13 |
.pdf |
|
|
10 |
|
14 |
.webm |
|
|
15 |
|
15 |
.php |
|
|
21 |
|
16 |
.mp3 |
|
|
0 |
|
17 |
.avi |
|
|
9 |
|
18 |
.wmv |
|
|
0 |
|
19 |
.xml |
|
|
3 |
| |
Average |
|
|
57 |
|
19 |
Totals |
|
|
1,098 |
|
|
|
 |
 |
 |

|
|
Help Card: File Types |
 |
This report shows the most requested types of files on your site. Use this information to see the preferred file type of visitors to your site, especially if they are given the option to view different file formats (such as PDF, HTML or text).
"[UNKNOWN]" entries are associated with hits to files without an extension, as well as hits to directories.
|
|
 |
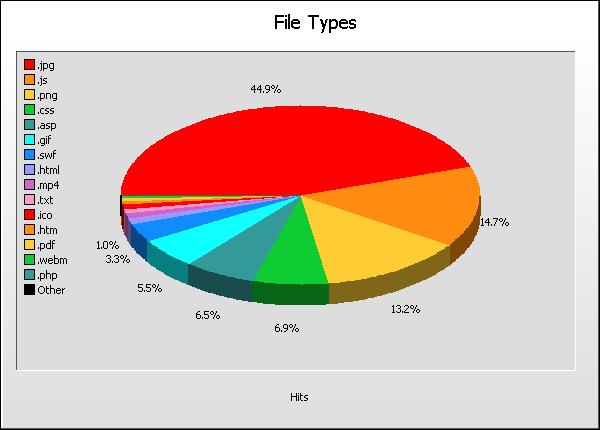
Pie Chart: Server Errors
Each portion of the graph represents a different file type, corresponding to the key in the top-left corner. It has an associated percentage value for clarity and is graphed by hits. This graph cannot be customized.
|
|
 |
File Type:
The extension (type) of the file being analyzed.
Hits (%):
Number of hits to files containing the corresponding file type. (Percentage as a proportion of hits to all files, regardless of their extension.)
Bytes (%):
Raw bytes transferred as a result of hits to files with corresponding extension. (Percentage as a proportion of bytes transferred for all files, regardless of their extension.)
Errors:
Number of server errors generated as a result of hits to files with the corresponding extension.
|
|
|
|

|
|